

One of the challenges that independent retailers have with accepting manufacturer category management tools such as planograms is about how they are created. Are they company biased or are they based on industry-wide sales data? As a retailer, I used my own data and Retail Newsagent’s ‘What to Stock’ supplement to validate if the planogram was right for our store.
I installed EPoS in 1994 at a time when there was only a small number of independent stores were using scanning tills. The only sources of comparative sales data were what supplier reps showed me. The tobacco reps were always surprised by how our sales varied compared to other stores both in Sussex and nationally. I also knew that my sales reflected the range we stocked and didn’t show me what we may have been missing out on.
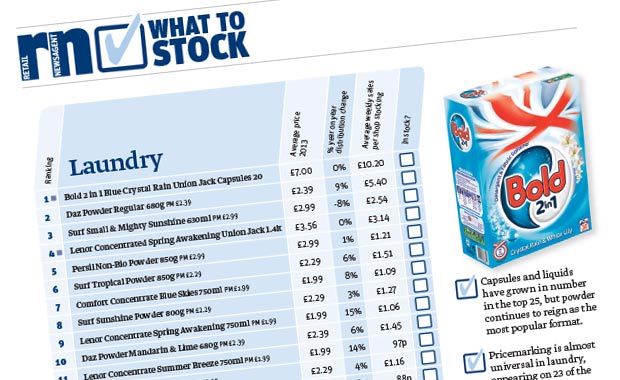
The What to Stock guide has the Top 25 sellers from across 24 categories, from beer to soft drinks, from hot beverages to laundry. The value of the guide is that the data is fed from the sales of around 2,000 independent stores from across the UK, and collated by EDFM. This gives independent retailers a source of unbiased product information to use as a benchmark against their own data and that claimed by manufacturers.
I compared P&G’s Shelf Help recommended laundry two-metre planogram with the What to Stock laundry best sellers, and found that 20 lines are in both lists.
Digging deeper, I wanted to see how their planogram reflected the industry. On the ShelfHelp two-metre planogram, 77% of the products are manufactured by Procter & Gamble and 19% by Unilever.
The manufacturer split in the What to Stock Guide is 70% from P&G and 30% from other suppliers which suggests that the planograms are indeed reflective of the wider industry as a whole
Comments
This article doesn't have any comments yet, be the first!