


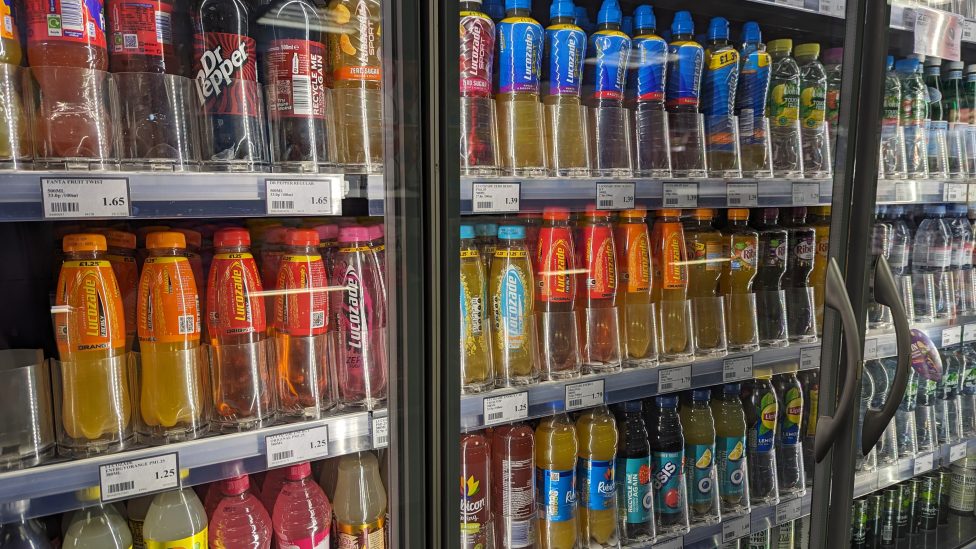
New analysis from Suntory Beverage & Food GB&I (SBF GB&I) has revealed the true impact of the Covid-19 Pandemic on the soft drinks category, showing just how important it has become to growing independent convenience retailers’ sales.
Data from the supplier shows the category saw above-average growth as a result of the pandemic. Between 2012 and 2018, soft drink value sales grew from £13.4bn to just over £16bn, a 19.9% increase[1]. However, despite an initial sales dip when the pandemic took hold in 2020, sales have rebounded to hit a high of £19bn in 2022 – an increase of 27%1.
This growth has been driven by an overall rise in purchase frequency, with 95.2% of households buying a soft drink over the year, up from 94.8% in the summer immediately prior to the pandemic [2].
Additionally, while summer is still the biggest period for sales, the gap between sales at the summer peak and the end of January (traditionally when sales are lowest) is narrowing. The average gap in sales between the summer highs of 2013 and 2014 and the corresponding lows of January 2014 and 2015 was 5.6% [3]- this declined to 3.7% between August 2021 and January 20223, demonstrating a more consistent sales period for the category. Men are also buying soft drinks more than women for the first time ever[4].
What’s more, the growth is being spearheaded by drinks that offer consumers functional health benefits. The penetration of stimulation drinks hit a high of 9% in summer 2022, having remained roughly around 5.8% in the decade leading up to April 2020[5]. Additionally, the penetration of sports drink sales grew by 66% from February 2020 to February 20225. Shoppers are generally seeking out soft drinks that are better for them: the number of occasions where soft drinks shoppers cite health as the major reason for their purchase has grown to 8.3%, up from 1.8% in 2014 [6].
Using this in-depth look back, SBF GB&I’s analysis of the category has discovered a £1.2bn extra sales opportunity going forward, if retailers tap into some key emerging trends.
These include: ensuring the seven out of 10 consumers who say they are interested in buying functional drinks [7] can buy what they need at an affordable price; encouraging the 75% of people who say they are concerned about tiredness7 to buy drinks that energise them; getting teetotal shoppers to buy soft drinks for special moments and occasions; promoting tastier hydration options than water and getting shoppers who identify as physically active to understand their benefits; and making soft drinks easier to buy for people looking for drinks to accompany an evening meal.
- Total soft drinks penetration has grown by 5.2% since 2012 [2]
- Soft drink sales have grown by 27% since summer 2022 [1]
- Penetration of sports drinks rose by 66% between pre-pandemic and February 2022 [5]

Claire Woolridge, category controller, SBF GB&I: “The pandemic saw many different purchasing habits creeping into everyday lives as routines changed. People have now settled into different routines, and with them different purchasing habits and patterns. These are impacting sales in interesting ways.
“Thanks to these changes, soft drinks are more valuable than ever before for convenience retailers, more people are buying into the category, and people are physically buying more drinks. Soft drinks have consistently delivered ahead of other categories and remained stable during tough economic times.”
[1] Kantar Global Data: UK Total mkt value & volume 10-year view & UK population
[2] Kantar Take-Home Panel, rolling data 12 w/e 07.08.22 – up from 90.2% ten years ago (October 2012)
[3] Kantar | Take-Home Panel | 12we Rolling Data | Category Tracking
[4] Kantar | Take-Home Usage Panel | 52 we Rolling Data | Soft Drink Sectors | Frequency | 10 Year Change Over Time
[5] Kantar | Take-Home Panel | 4we Rolling Data | Soft Drink Sectors | Penetration | 10 Year Trends
[6] Kantar | Take-Home Usage Panel | 52 we Rolling Data | Soft Drink Sectors | % Share of Servings PP Change | 52 w/e 10th July 2022 10 Year Change
[7] SBF GB&I data v. Euromonitor CAGR forecast
Comments
This article doesn't have any comments yet, be the first!