
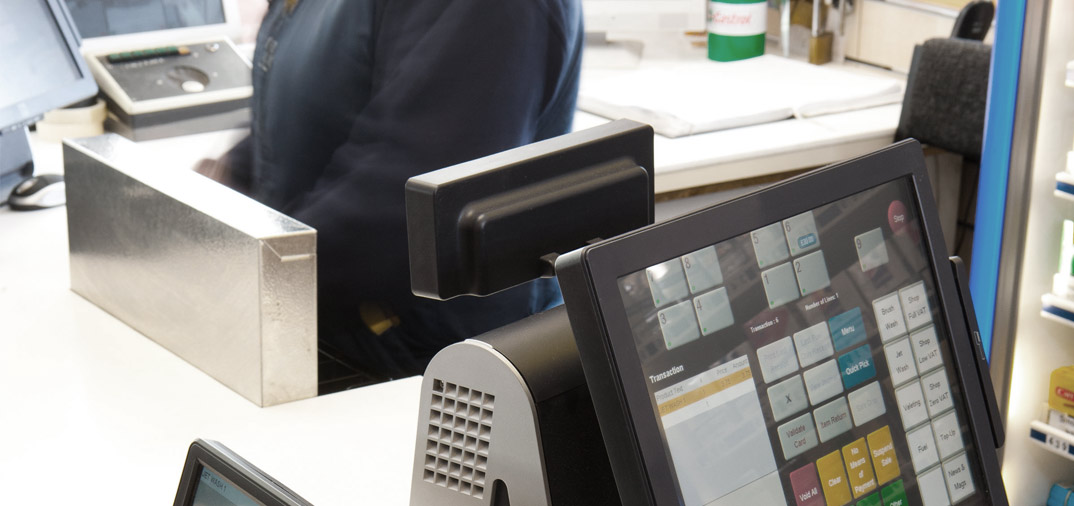
I operate my store under the Spar fascia and use sales data from my store’s SparPos system to improve both my gross profit and the look of the store. Each week the system provides me with a category level sales and gross profit report and I use this as a basis of understanding the current strengths and weaknesses in the performance of my business. Every Sunday morning I record these figures on to a spreadsheet and analysis the data particularly searching for areas where we can make improvements.
SparPos hold 13 weeks of product line sales data and each quarter I take a complete copy of this information an again save it on to a spreadsheet. I have been doing this for several years so can see year on year on year changes easily. As the data is stored on a spreadsheet it is simple to look as a graph to see which way the gross profit is moving.
Sales data is my Sunday morning treat
As I said I set aside every Sunday morning to look at and analysis the sales data that is collected through my scanning tills. I am particularly looking for parts of the business that are under-performing and think about how the sales can be improved.
For categories or sub categories that go through a review and merchandise change process I look at the sales data on a weekly basis to see what differences the alterations have made. If the picture for a particular product is out of line with the effect of a remerchandising on the rest of the range then I know to investigate the reason and make a tweak.
An example of my process can be revealed from a recent remerchandising of my spirits range. On a recent visit to my In-laws I took a look at a new Tescos Express that had opened nearby. I do have to add that I use all visits to shops as a learning opportunity. While I didn’t find anything to learn from walking around the store that changed when I approach the check out area.
Behind the counter their spirits display jumped out at me. It was much better than mine. When ever I see any display that I think that I can learn from I photograph it and this Tesco moment was no different.
Armed with the Tesco display photo I compared it to a photograph of the display at my store. I was surprised to discover that their product range was very similar to mine, but their merchandising plan looked more effective. As you can see from this series of photographs I changed my spirits merchandising plan several times before I was completely satisfied with the shelf layout.
Each change was driven by the sales data and I identified which lines were performing poorly and repeatedly tweaked the display until I was happy with how every line was working. I then had space to enhance my range of single malts.
The results are plain to see with sales up 11% and gross profit up by 12%.
An unexpected effect was that the weekly gross profit of my small fortified wine range that I had moved to a lower shelf and squeezed the space slightly had grown by 50% from £10 to £15!
My review of the scanning data is driven by 2 factors; to improve gross profit and to improve the look of the store. I know that this process is helped by borrowing great ideas from other retailers and my library of photograph help me with this.
Comments
This article doesn't have any comments yet, be the first!